How to Calculate Cost per Hire by Recruitment Channel
Cost per Hire Formula:
Cost per Hire = (Internal Recruiting Costs + External Recruiting Costs) ÷ Total Number of Hires
The cost per hire measures the total recruiting expense required to hire one employee within a specified period. It includes internal recruiting costs and external vendor or advertising spend.
However, most organizations calculate it incompletely.
They track visible vendor invoices and ignore recruiter salary allocation, hiring manager time, and infrastructure costs.
As a result, the reported cost per hire appears lower than reality, and sourcing decisions become distorted.
However, a structured calculation can fix this.
Understand this: when recruiting teams separate internal and external costs and measure cost per hire by recruitment channel, they identify which sourcing strategies actually produce efficient hires.
Specifically, this guide explains:
- The formula to calculate the cost per hire by the recruitment channel
- Step-by-step calculation
- Channel-level modeling
- Volume impact
- How automation affects cost drivers
*Note*: The numerical examples below illustrate allocation logic. Actual cost per hire varies significantly by geography, compensation structure, and role complexity.
What Is Cost per Hire?
Cost per hire is a recruiting metric that measures the average total expense required to hire one employee during a defined period.
It includes costs such as job advertising, recruiter fees, onboarding, and recruitment tools.
Many organizations also invest in HR solutions like Employee Reward Software to improve employee satisfaction and retention, which can ultimately reduce future hiring costs.
How to Calculate Cost per Hire (Step-by-Step with Formula)
You calculate cost per hire by adding total internal and external recruiting costs during a defined period and dividing that amount by the total number of hires made in the same period.
Cost per Hire = (Total Internal Recruiting Costs + Total External Recruiting Costs) ÷ Total Number of Hires
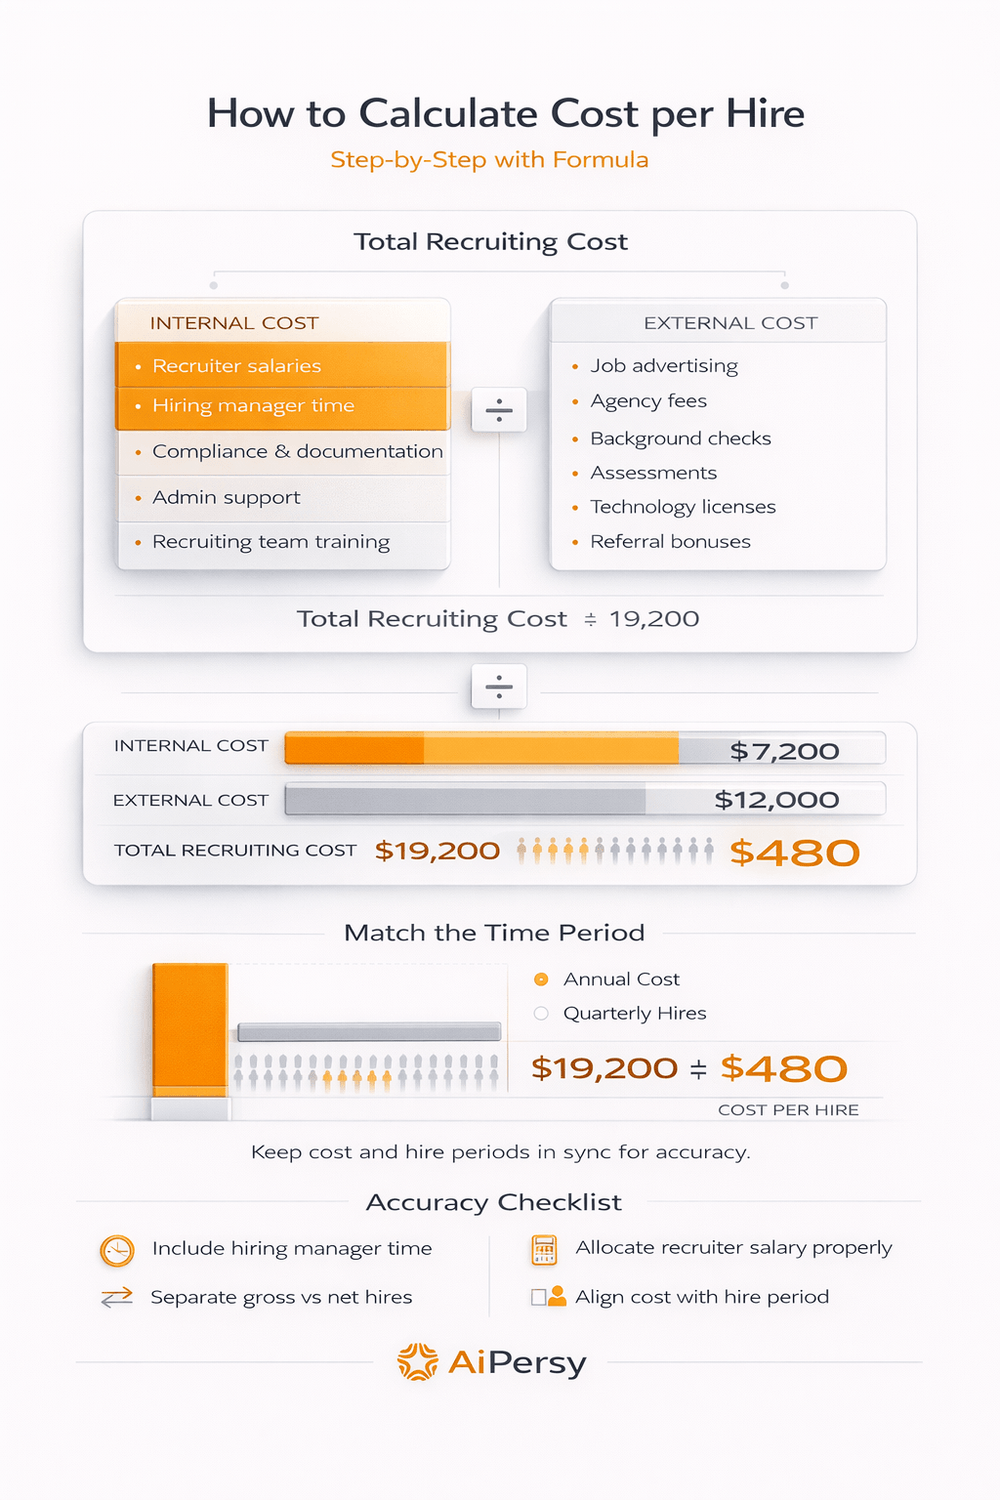
Follow these four steps to calculate it accurately.
1. Calculate Total Internal Recruiting Costs
Include all costs tied to the internal hiring effort:
Recruiter salaries and benefits (allocated by time spent hiring)
Hiring manager interview hours
Compliance and documentation processing
Administrative support allocation
Recruiting team training
Allocate the recruiter's salary proportionally. If recruiters spend 60% of their time hiring, allocate 60% of their compensation.
2. Calculate Total External Recruiting Costs
Include expenses paid to third parties:
Job board advertising
Recruitment agency fees
Background checks
Pre-employment assessments
Technology licenses (ATS, sourcing tools)
Referral bonuses
Campus hiring or job fair expenses
Allocate technology costs proportionally if systems support multiple HR functions.
3. Add Internal and External Costs
Example (Quarterly):
Internal Costs = $7,200
External Costs = $12,000
Total Recruiting Cost = $19,200
4. Divide by Total Number of Hires
If the organization hired 40 employees during the quarter:
$19,200 ÷ 40 = $480 cost per hire
Ensure the cost period and hire count match. Mixing annual costs with quarterly hires inflates or understates the result.
Accuracy Tips
Include hiring manager time. Many organizations exclude it.
Allocate recruiter salary based on actual hiring effort.
Separate gross hires from net retained hires.
Use consistent time periods for comparison.
Internal vs External Cost per Hire
Cost per hire combines internal recruiting costs and external vendor expenses.
The internal costs relate to the organization’s own hiring infrastructure. External costs reflect payments made to third parties to attract or evaluate candidates.
Internal costs often behave as fixed or semi-fixed expenses, meaning they do not increase immediately with each additional hire.
Whereas, the External costs behave as variable expenses that increase with sourcing intensity.
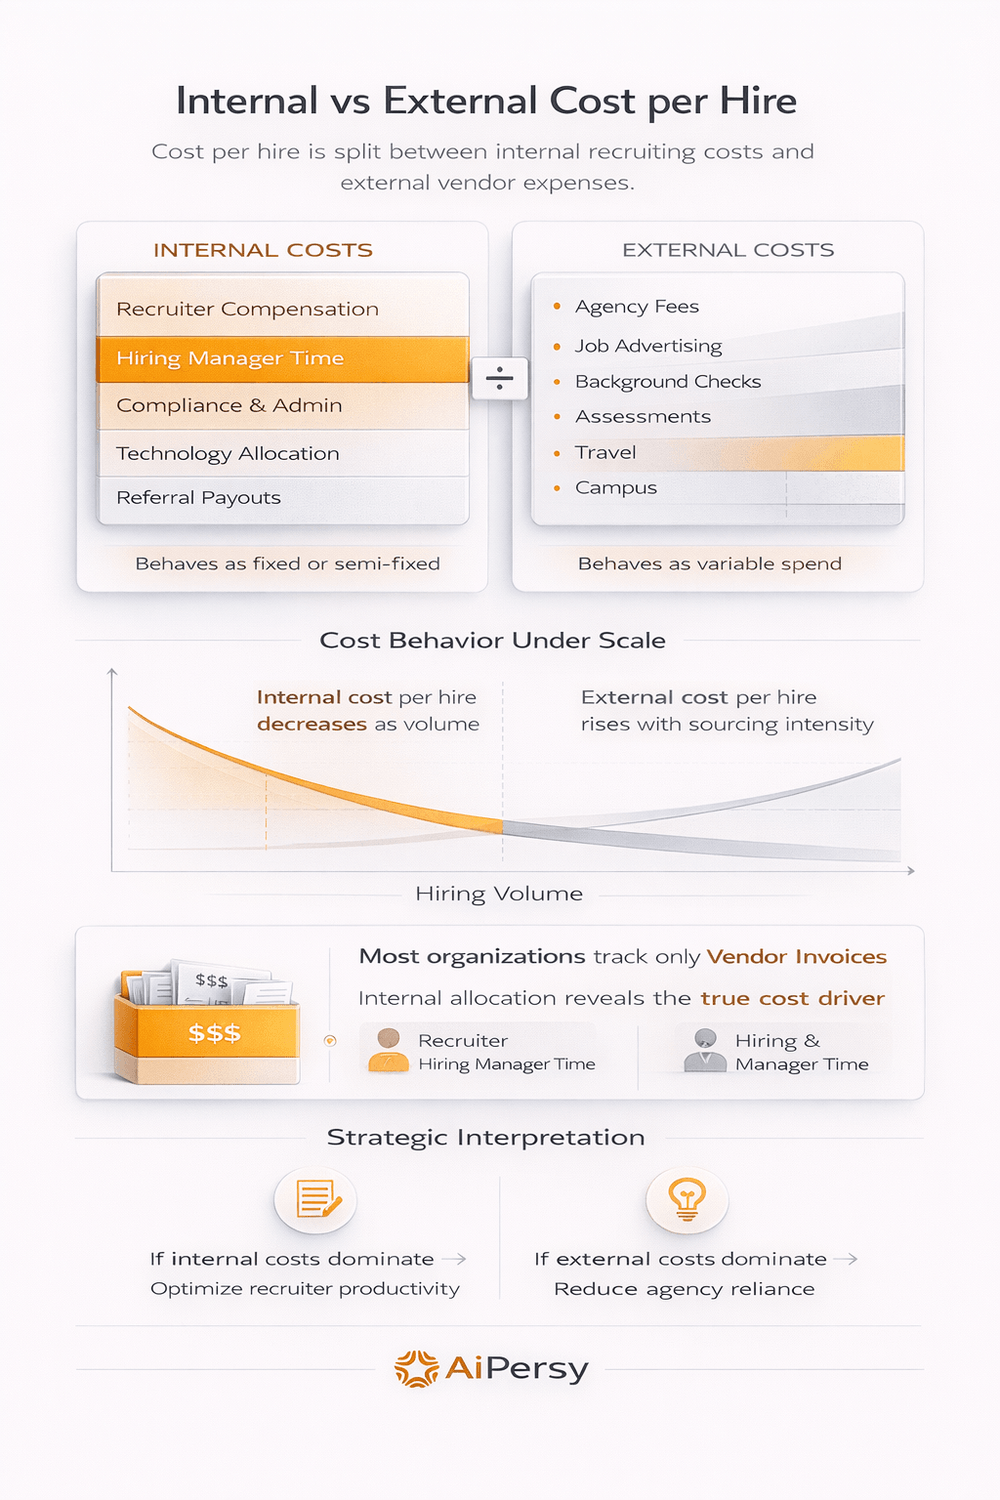
Internal Costs
Internal costs include compensation, infrastructure, and administrative support tied to hiring activity.
| Internal Cost Category | What It Includes |
| Recruiter Compensation | Salaries, bonuses, benefits (allocated by hiring time) |
| Hiring Manager Time | Interview hours, evaluation time |
| Compliance & Admin | Documentation processing, HR support allocation |
| Technology Allocation | ATS usage, sourcing tools, HRIS allocation |
| Recruiting Training | Upskilling and certification for recruiting staff at scale |
| Internal Referral Payouts | Bonuses processed through payroll |
External Costs
External costs include payments made to vendors like third-party background verification agencies or other market channels.
| External Cost Category | What It Includes |
| Agency Fees | Often 15–30% of first-year salary |
| Job Boards & Advertising | LinkedIn, Indeed, paid campaigns |
| Background Checks | Criminal, education, and eligibility verification |
| Assessments | Pre-employment tests and screening tools |
| Candidate Travel | Flights, lodging, relocation expenses |
| Campus & Job Fairs | Event sponsorship and logistics |
| RPO or Consulting Fees | Outsourced recruitment support |
Internal cost per hire decreases as hiring volume rises; moreover, fixed recruiter salaries spread across more hires, lowering the average.
External cost per hire may rise if sourcing channels demand more paid visibility or agency reliance. As a result, the hiring spend shifts outside the organization.
Many organizations underestimate internal cost per hire because they track only vendor invoices; however, proper allocation reveals whether recruiter time or agency spend drives total hiring investment.
How to Calculate Cost per Hire by Recruitment Channel
You calculate cost per hire by recruitment channel by dividing the total expenses associated with a specific sourcing channel by the number of hires generated from that channel within the same time period.
Channel Cost per Hire = (Total Channel Spend + Allocated Internal Costs) ÷ Hires from That Channel
Follow these four steps.
1. Define the Time Period
Use a consistent timeframe, such as quarterly or annually, because channel comparisons become unreliable when costs and hires come from different periods.
2. Identify Direct Channel Spend
Include costs directly tied to that sourcing source:
Job board advertising fees
Agency placement commissions (often 15–30% of salary)
Referral bonuses
Campus hiring event costs
LinkedIn sourcing licenses
Example (Quarterly – LinkedIn Ads): LinkedIn spend = $4,800
3. Allocate Internal Recruiting Costs
Recruiters and hiring managers work across multiple channels. Their time should be allocated proportionally.
For example, if recruiters spend:
50% of hiring effort on LinkedIn sourcing
30% on referrals
20% on agency coordination
And quarterly recruiter cost equals $9,600: LinkedIn allocation = $4,800
Add hiring manager time allocation if interviews came primarily from that channel. This reveals the full cost picture.
Failure to allocate internal time understates the true channel cost per hire. Therefore, accurate distribution becomes essential for ROI analysis.
4. Divide by Channel Hires
Example:
- Direct LinkedIn spend = $4,800
- Allocated recruiter cost = $4,800
- Total channel cost = $9,600
Hires from LinkedIn = 16
$9,600 ÷ 16 = $600 cost per hire; consequently, the true channel cost becomes visible when recruiter time and direct spend are combined.
Channel Comparison Example
| Channel | Total Channel Cost | Hires | Cost per Hire |
| $9,600 | 16 | $600 | |
| Referrals | $3,600 | 25 | $144 |
| Agencies | $14,400 | 15 | $960 |
| Career Site | $2,400 | 18 | $133 |
| Campus Hiring | $6,000 | 40 | $150 |
Total cost per hire alone would hide these differences. In contrast, channel-level allocation reveals where efficiency is strongest and where spend runs high.
When Channel Cost per Hire Becomes Misleading
When it comes to recruitment, the channel‑level analysis fails when:
- Recruiter time is not allocated accurately
- Shared technology costs are excluded
- Offer acceptances shift between quarters
- Low‑volume channels produce only 1–2 hires
Small hire counts inflate channel cost per hire artificially; therefore, channel performance should be evaluated over stable hiring cycles.
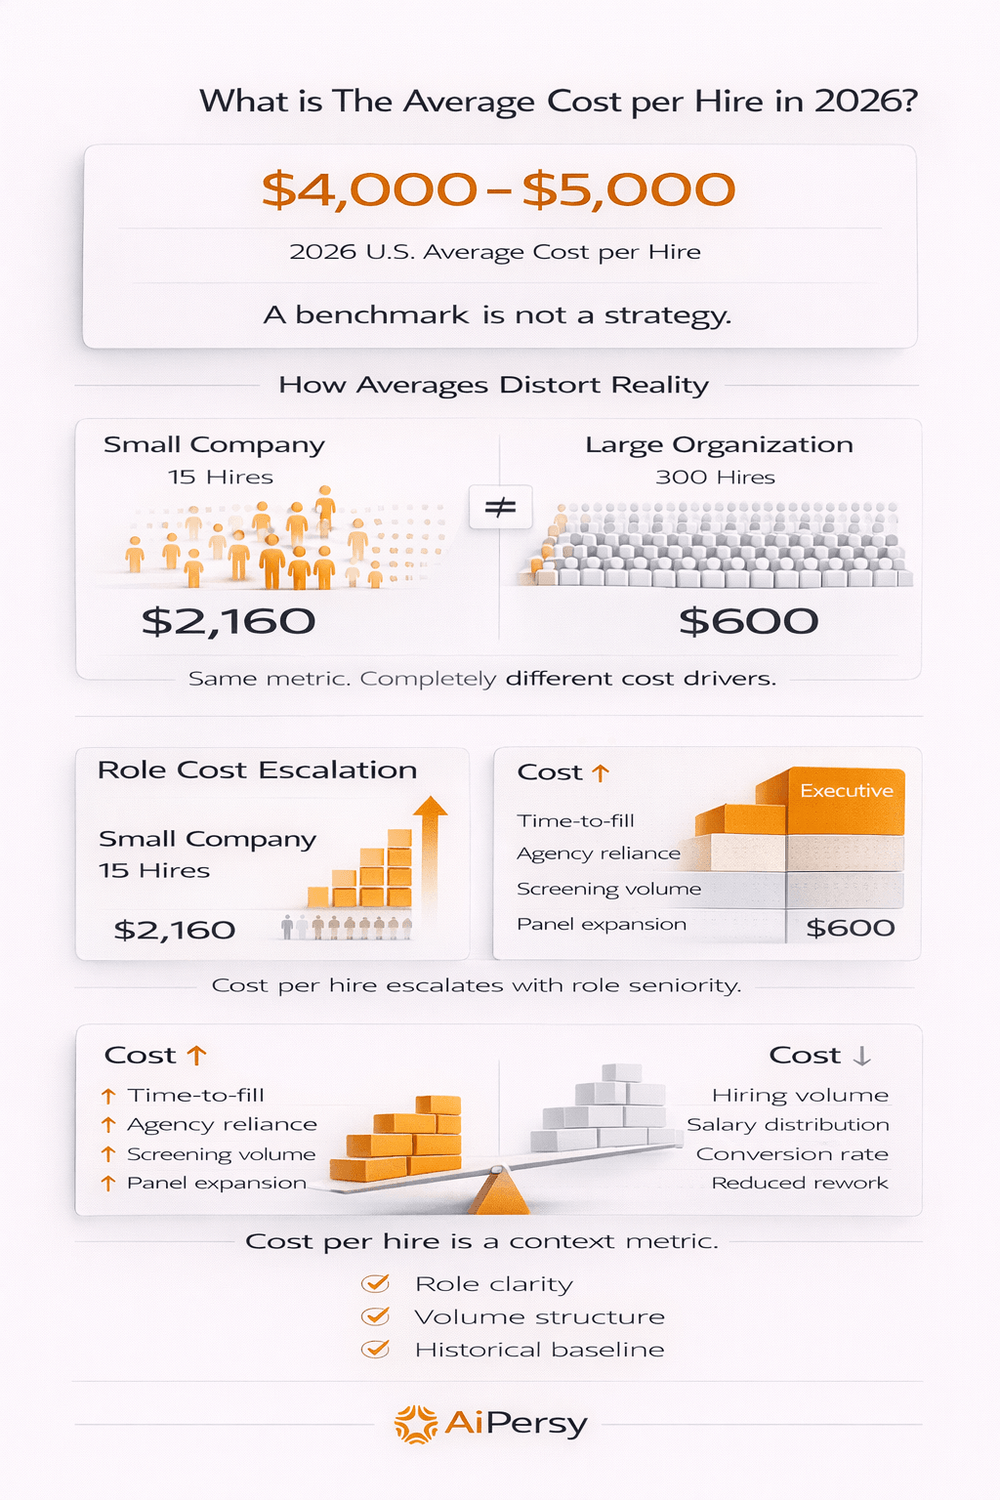
What is The Average Cost per Hire in 2026?
In 2026, widely cited U.S. benchmarks place the average cost per hire between $4,000 and $5,000.
However, this figure varies significantly by industry, geography, seniority, and hiring volume because a single global average does not reflect operational reality.
Cost per hire becomes meaningful only when segmented by role type and scale.
Indicative Cost Ranges by Role Level
| Role Type | Typical Cost Behavior |
| High-Volume / Entry-Level | Lower external spend, higher screening workload |
| Mid-Level Professional | Balanced sourcing and evaluation cost |
| Specialized / Technical | Higher sourcing cost and longer time-to-fill |
| Executive Hiring | Often 15–30% of first-year compensation (agency-led) |
Executive search firms commonly operate on percentage-based fee structures. Consequently, senior hiring drives disproportionate cost per hire even when volume remains low.
What Drives Cost Variation in Hiring
Cost per hire increases when:
Time-to-fill extends
Agency reliance increases
Applicant screening volume spikes
Interview panel size expands
Relocation or signing bonuses apply
Cost per hire decreases when:
Hiring volume increases
Recruiter salaries distribute across more hires
Conversion rates improve
Screening rework declines
Small operational shifts drive these variations; therefore, cost per hire must be interpreted in context rather than as a static benchmark.
Why Averages Alone Mislead
Two organizations can report the same average cost per hire while operating with completely different hiring models.
Example:
A technology firm hiring 15 engineers may report $2,160 per hire.
A retail organization hiring 300 associates may report $600 per hire.
Both may operate efficiently within their own context; therefore, cost per hire should be evaluated against internal historical performance before comparing external benchmarks.
How Hiring Volume Impacts Cost per Hire Calculation
Higher hiring volume typically lowers cost per hire because fixed recruiting costs are spread across more hires. However, cost per hire decreases only when internal capacity absorbs volume without increasing external spend.
Recruiting contains both fixed and variable costs. Understanding this distinction explains cost behavior under scale.
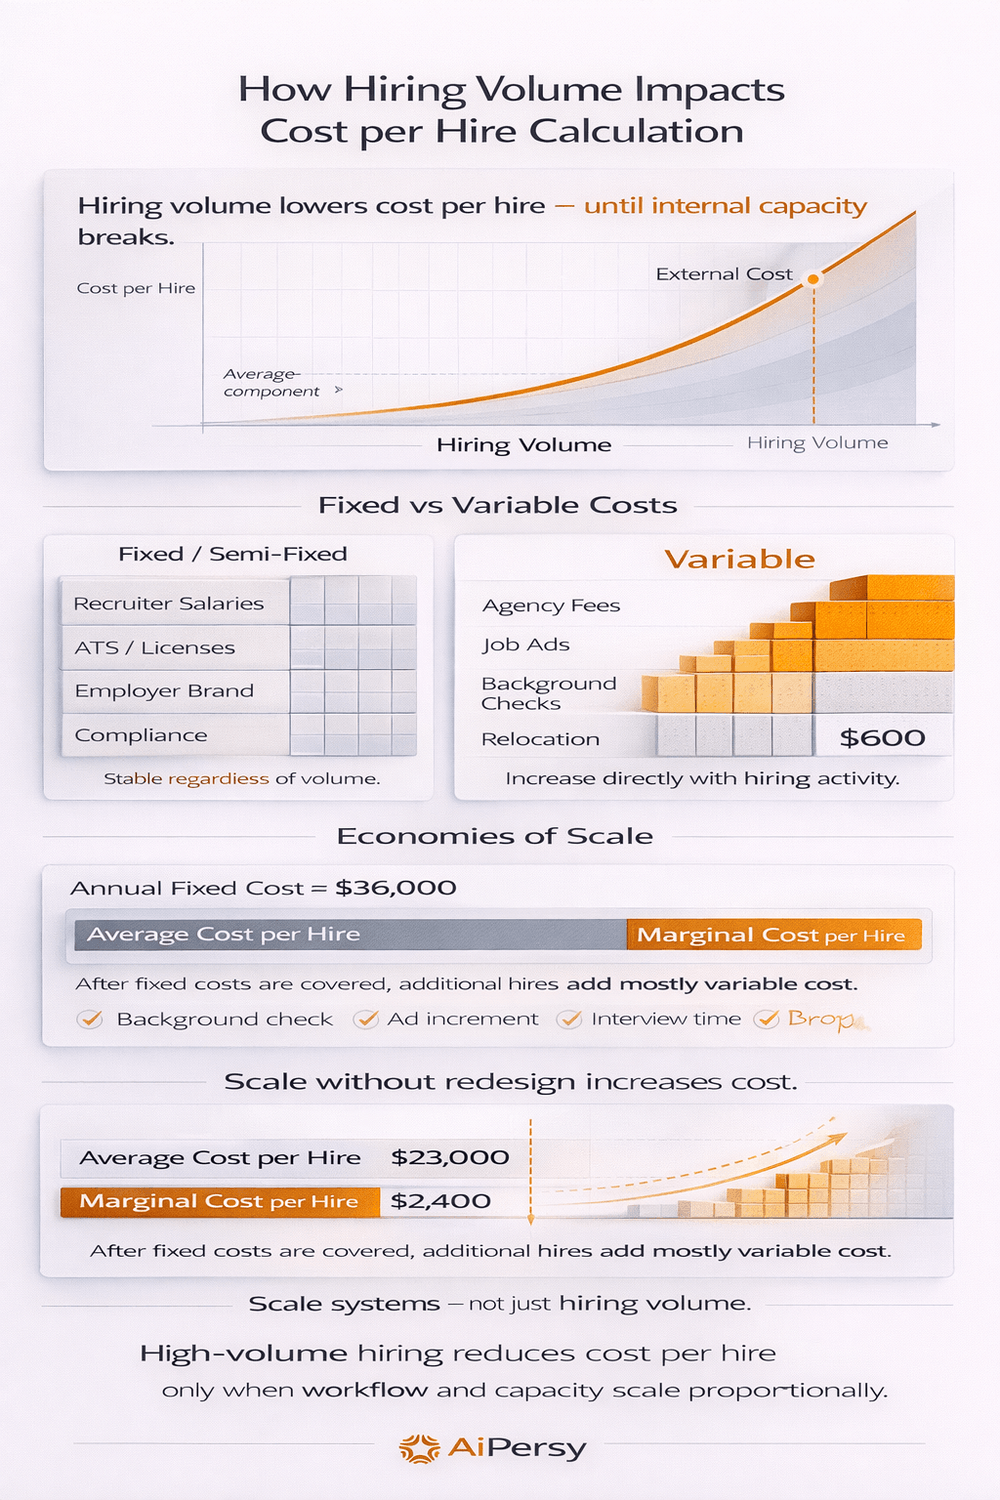
Fixed vs Variable Cost Behavior
Fixed or semi-fixed costs include:
Recruiter salaries
ATS and sourcing licenses
Employer branding infrastructure
Core compliance overhead
These costs remain stable regardless of hiring volume.
Variable costs include:
Agency placement fees
Job board advertising
Background checks
Relocation and signing bonuses
These costs rise directly with hiring activity. As a result, understanding the split between fixed and variable spend becomes essential for accurate cost analysis.
Economies of Scale Example
Assume annual fixed recruiting cost equals $36,000.
If the organization hires:
15 employees → $36,000 ÷ 15 = $2,400 per hire
60 employees → $36,000 ÷ 60 = $600 per hire
Cost per hire drops because fixed infrastructure distributes across more hires. This effect is called economies of scale, where the average cost decreases as the hiring volume increases.
Marginal Cost per Hire
Marginal cost per hire refers to the additional cost of hiring one more employee after fixed recruiting costs are already covered.
After fixed costs are covered, each additional hire primarily adds variable cost.
For example, if recruiter salaries remain unchanged and hiring increases from 60 to 70 roles, the marginal cost per hire may equal only:
Background check
Advertising increment
Interview time
Marginal cost often remains significantly lower than average cost per hire. For this reason, understanding this distinction helps organizations plan scale without overstating investment.
When Volume Increases Cost per Hire
Cost per hire increases under scale when hiring volume exceeds internal capacity.
Examples:
Recruiters rely on agencies to manage backlog
Overtime screening increases labor cost
Interview cycles repeat due to rushed evaluation
Conversion rates decline under pressure
In these cases, variable cost expands faster than fixed cost distributes. As a result, scale without process redesign inflates cost per hire instead of reducing it.
Most mid‑sized teams strain capacity when one recruiter manages more than 25–30 concurrent open roles. Beyond that threshold, recruiters increase agency reliance and repeat screening rework.
Therefore, high‑volume hiring reduces cost per hire only when workflow and capacity scale proportionally.
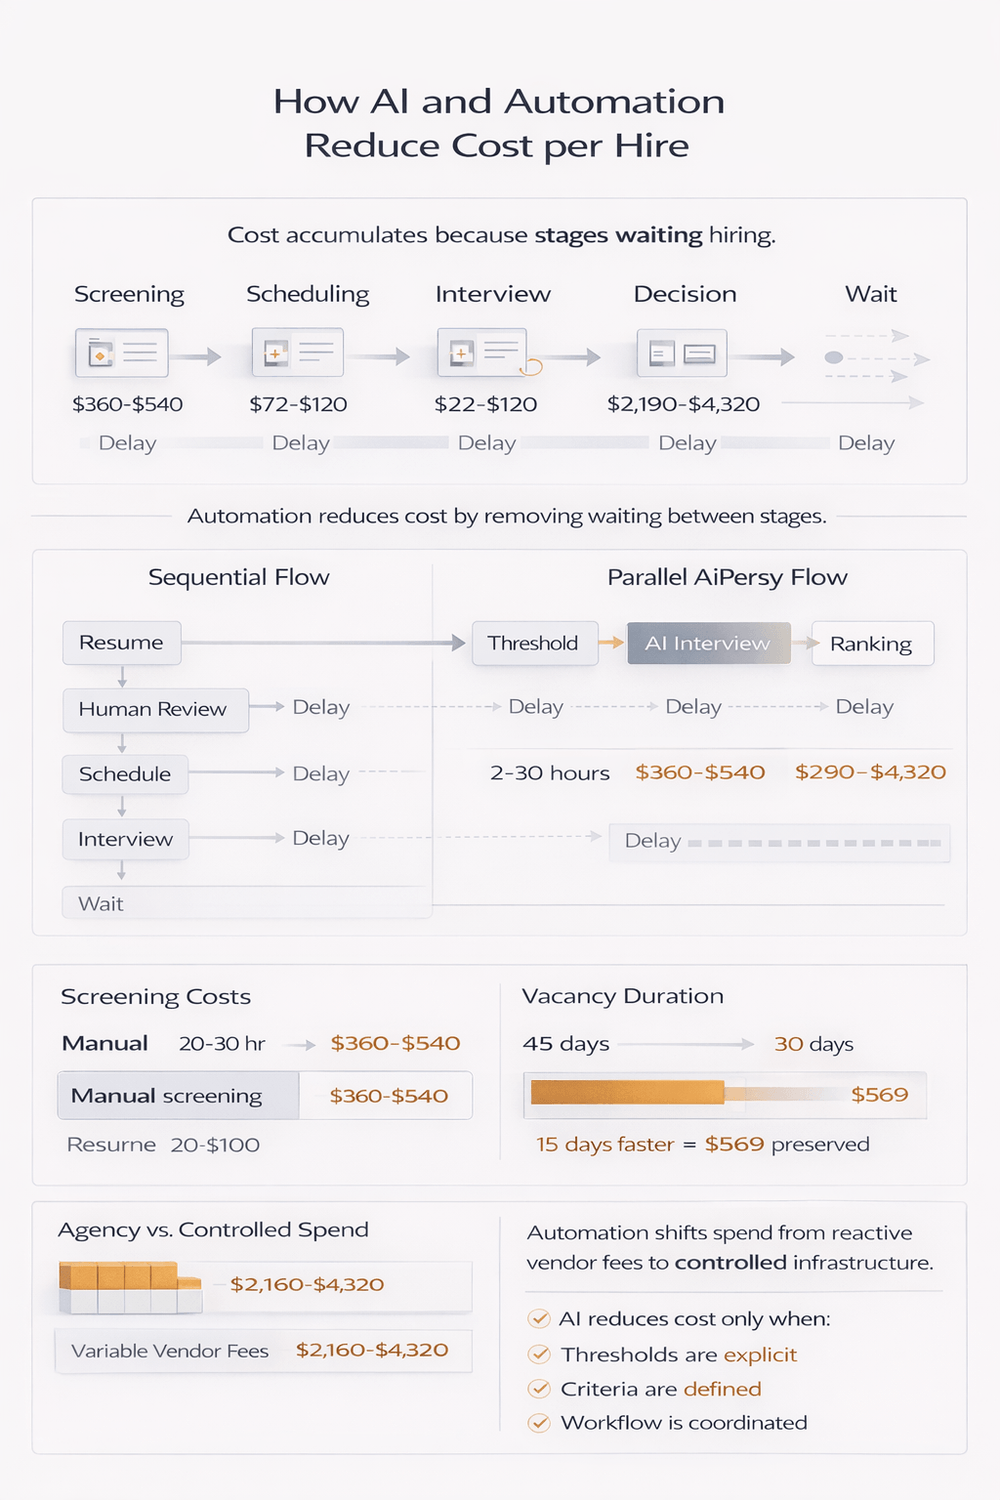
How AI and Automation Reduce Cost per Hire
AI and automation reduce cost per hire by lowering the primary cost drivers in recruiting: screening time, vacancy duration, scheduling overhead, and reliance on third-party agencies.
Automation reduces cost when it removes manual workload without creating rework or false positives.
The impact becomes measurable when recruiters link automation directly to time allocation and vacancy cost.
Here's how:
1. Reduced Resume Screening Time
Manual screening consumes 20–30 recruiter hours per 500 applications. At $18 per hour, that equals $360–$540 in screening cost for a single high-volume role.
Structured automation can reduce manual review time to 5–8 hours by pre-filtering based on defined criteria. That lowers recruiter salary allocation per hire without expanding headcount.
This benefit fails when AI relies on keyword matching without structured thresholds.
In those cases, false positives increase, and recruiters re-screen candidates manually.
False positives occur when unqualified candidates pass automated screening and require manual correction later.
2. Faster Shortlist Generation and Reduced Vacancy Cost
Every unfilled revenue-generating job role carries an opportunity cost. For a $10,800 annual salary role, each working day represents roughly $41/day in productivity value ($10,800 ÷ 261 days).
If AI recruiter software reduces time-to-fill from 45 days to 30 days, the organization saves 15 days of vacancy exposure.
In this context, vacancy exposure refers to the productivity or revenue lost while a role remains unfilled.
15 × $41 = $569.18 potential productivity preserved.
This impact depends on process coordination. If interview scheduling remains manual, time-to-fill may not improve.
3. Lower Scheduling and Administrative Overhead
Interview coordination typically consumes 3–5 hours per hire across recruiters and hiring managers. At a $24/hour blended cost, that equals $72–$120 per hire.
Automated scheduling and structured workflows reduce manual coordination time. However, savings remain limited in low-volume hiring where scheduling complexity stays manageable.
4. Reduced Agency Dependency
Recruitment agencies charge 15–30% of the first‑year salary. For a $14,400 role, agencies bill $2,160–$4,320 per hire.
When automation strengthens internal sourcing and screening capacity, organizations reduce agency reliance. This shift moves spend from variable vendor fees to fixed internal infrastructure.
Agency reduction fails when internal teams lack sourcing capability or when roles demand niche executive search expertise.
5. Reduced Rework and Interview Repetition
Unstructured screening increases false positives. Interview panels repeat rounds to correct evaluation errors, increasing internal labor cost.
Structured automation applies consistent criteria at scale. When evaluation logic remains explicit, interview cycles shorten and rework declines.
This benefit disappears if the criteria remain vague or hiring managers override structured thresholds without proper calibration.
Common Mistakes in Cost per Hire Calculation
Cost per hire becomes unreliable when organizations exclude essential factors like internal allocation, mix time periods, or compare averages across different types of job roles.
These mistakes compromise budgeting decisions and sourcing strategy. Below are the most common calculation errors and how to correct them.
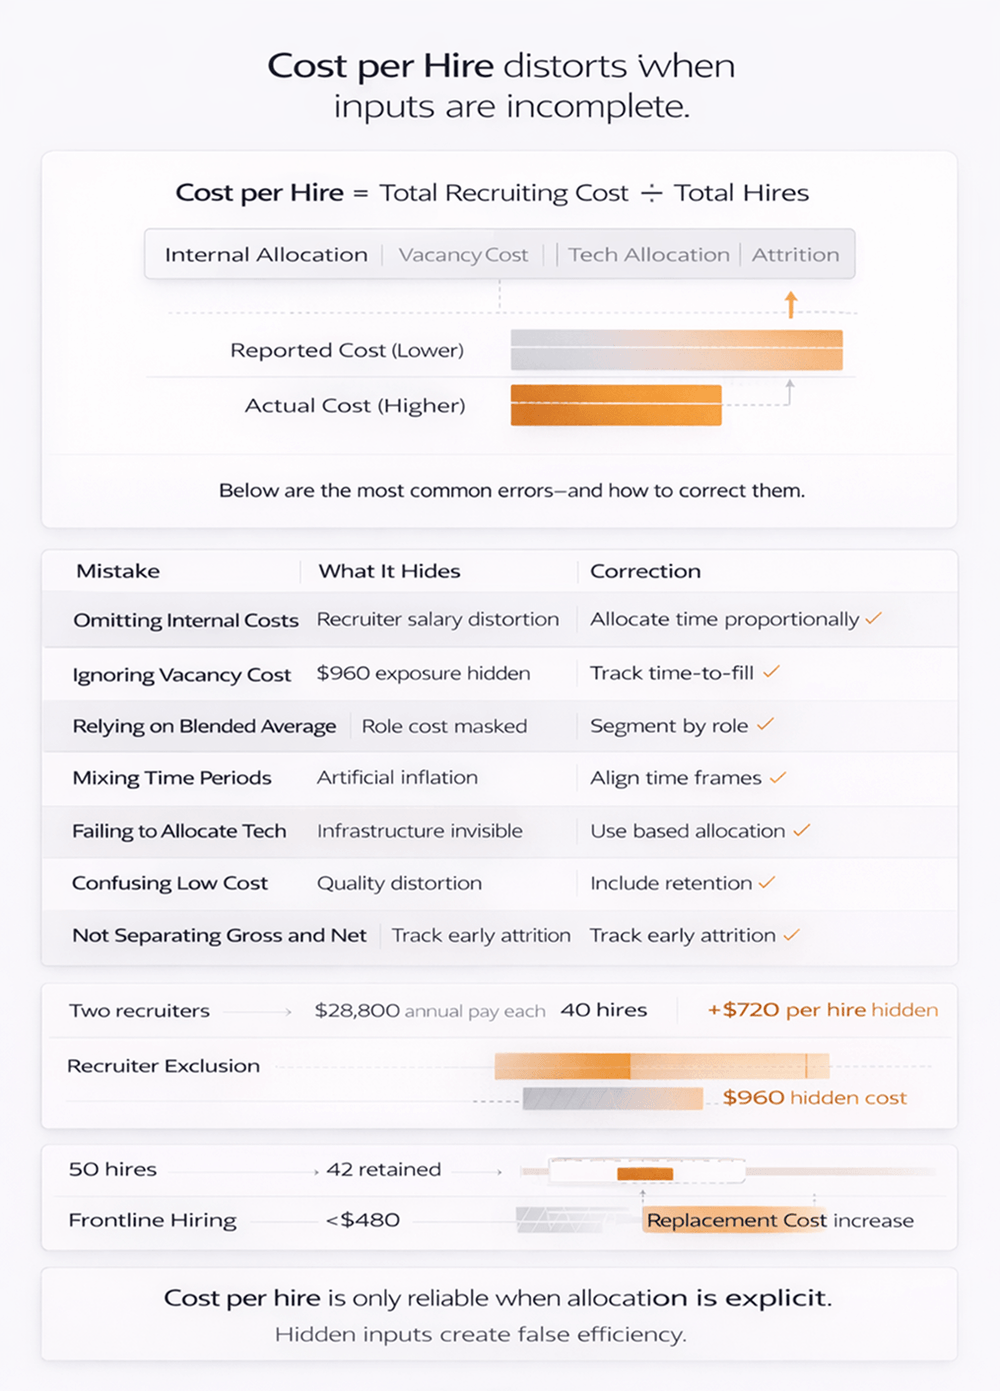
1. Omitting Internal “Hidden” Costs
Many TA teams include only advertising and agency invoices while ignoring recruiter salaries and hiring manager time.
If two recruiters earn $28,800 annually and the company hires 40 employees, excluding recruiter cost understates the cost per hire by $720.
Fix: Allocate recruiter and hiring manager time proportionally based on actual hiring effort.
2. Ignoring Vacancy and Opportunity Cost
Cost per hire focuses on recruiting expense but often excludes the cost of an unfilled job role.
For example, if a revenue-generating role worth $48 per working day remains vacant for 20 additional days, opportunity exposure equals $960.
Fix: Track time-to-fill alongside cost per hire to understand total hiring economics.
3. Relying on a Single Blended Average
A blended average across all roles hides cost differences.
Executive hiring may exceed $1,800 per hire, while high-volume frontline hiring may remain below $480. Comparing the two creates misleading conclusions.
Fix: Segment cost per hire by role category, department, or channel.
4. Mixing Time Periods
Dividing the annual recruiting cost by quarterly hires inflates the cost per hire. Using inconsistent periods produces incorrect comparisons.
Fix: Ensure total recruiting cost and hire count align within the same defined timeframe.
5. Failing to Allocate Technology and Infrastructure
ATS subscriptions, sourcing tools, and assessment platforms support hiring activity. Treating them as general HR overhead lowers reported cost per hire artificially.
Fix: Allocate technology costs based on recruiting usage percentage.
6. Confusing Low Cost with Efficient Hiring
A very low cost per hire may indicate overreliance on limited sourcing channels, rushed screening, or low conversion quality.
Lower upfront cost does not guarantee lower total hiring cost if early attrition increases replacement expense.
Fix: Evaluate cost per hire alongside retention and performance metrics.
7. Not Separating Gross and Net Hires
If 50 hires occur but 8 exit within 90 days, dividing the total cost by 50 hides the rework expense.
Fix: Track early attrition separately and analyze the replacement cost impact.
Final Words
In conclusion, calculating cost per hire should be your decision-making template only when internal and external costs are fully allocated and measured consistently within defined time periods.
When organizations rely on blended cost per hire, performance differences between sourcing channels remain hidden. Channel-level allocation makes those differences visible.
Hiring volume reduces cost per hire only when fixed recruiting infrastructure scales without increasing agency reliance or screening rework.
Here, the screening rework refers to repeating candidate evaluation because the earlier filtering was inaccurate.
AI recruiting tools reduce hiring costs only when they remove manual friction and shorten time-to-fill without introducing false positives or process complexity.
Therefore, cost per hire should not be treated as a standalone benchmark. It should be evaluated alongside:
Time-to-fill
Conversion rates
Retention outcomes
Channel performance
First, allocate recruiter and hiring manager time accurately.
Second, segment cost per hire by channel and role category.
Third, analyze how fixed and variable costs behave under scale.
Then optimize the sourcing strategy.
Related Reading
If you want to see how structured cost tracking connects with parallel screening workflows, AI recruiting software like AiPersy calculates recruiter allocation automatically as candidates move through defined stages. Don't miss the early access!